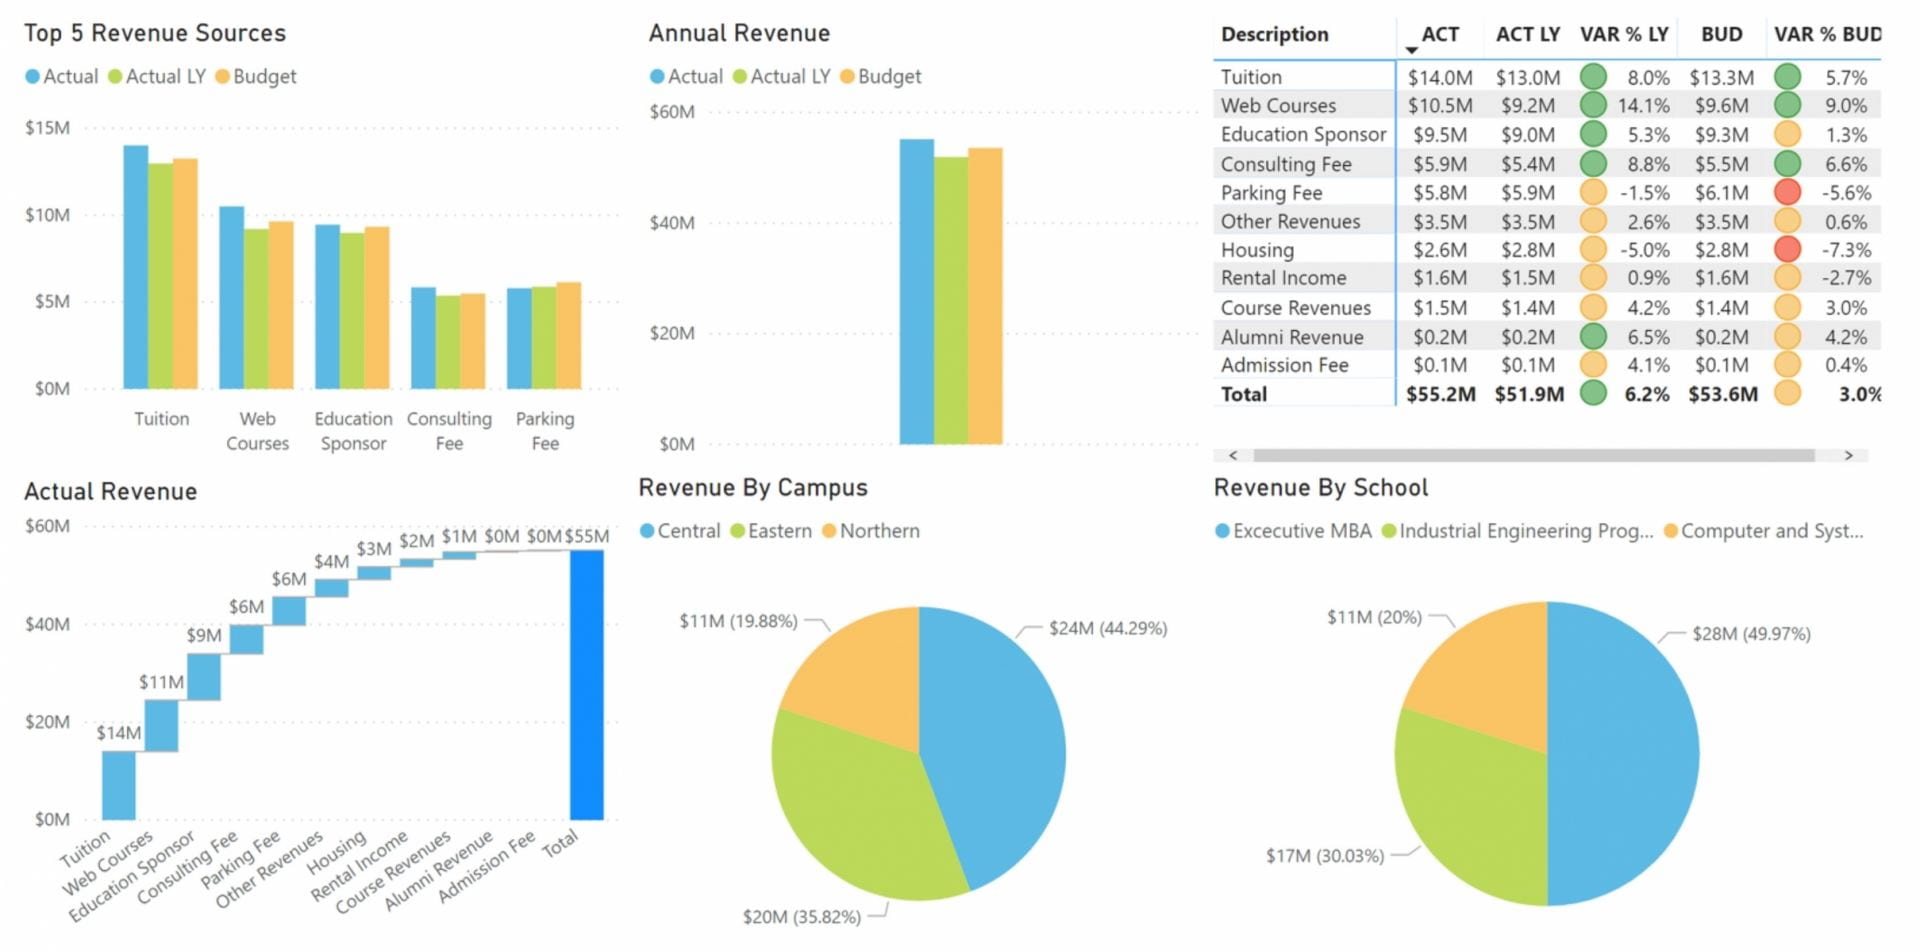
Microsoft Power BI is a business intelligence tool that provides users the ability to aggregate, analyze, visualize and share data. Power BI’s user interface is fairly intuitive (Excel-like), making it a very versatile tool. Power BI can be used to tell stories through charts and data visualizations, and dashboards can be created to give administrators and managers various insights.
We are pleased to provide our faculty and staff Power BI Pro licenses. Please see the “Access” section below for more information.
You may see sensitive data when building or viewing Power BI dashboards. Please abide by all University data use and confidentiality policies.
WashU-specific Power BI Documentation
- How to Obtain Power BI Desktop
- Connecting to a Data Source File on OneDrive or SharePoint and Setting up a Refresh Schedule
Beginner-level Power BI courses
- Explore what Power BI can do for you (module)
- Learning Path (6 modules): Create and Use Analytics Reports with Power BI
Power BI can be connected to the WashU data warehouse to produce dashboards, insights and reports. Please note that access to data is different from access to reporting tools like Power BI. You can only visualize data to which you have access.
All users of Power BI and other data tools should be aware of appropriate use of data. Please watch this video before requesting access to Power BI.
To request a faculty/staff license for Power BI Pro, please complete and submit this form. You will also need to download the latest version of Power BI. Sorry, student licenses are not being offered at this time.
Please note that the Power BI Desktop client is not available to Mac users.
If you are a Mac user and just need to view dashboards, the web version of Power BI should meet your needs. If you need to connect to a database, however, you will need to run the Power BI Desktop client on a Windows simulator like Parallels (available in your app store).
Publishing Power BI reports to the web is strictly prohibited. Exceptions to this rule will require justification from business managers and leadership approval. If you need web-publishing capabilities, please email the Data Team.