Data Warehouse Reporting & Analytics
WashU has defined a strategic vision to develop a centralized repository of data so that a shared, single source of truth may exist. This central repository, called a data warehouse, along with tools, training and processes, empowers our community to leverage the university’s data as an asset. Our goal is for units to use this asset, through reporting and analytics, to help them make insight-driven decisions.
Learn how the Data Warehouse works
Watch this video to better understand all the components working together to make our data warehouse a university asset driving WashU forward.
The Data Warehouse contains both Legacy and Current data from many different systems/sources and will continue to expand as time goes on. To learn more about our legacy systems retirement plan, click the button below.

Reporting vs. Analytics:
What’s the difference?
Operational Reporting is the process of organizing data into informational summaries in order to monitor how different areas of business are performing.
Reporting is typically focused on one area of business.
Reporting looks at the past.
Analytics lets us transform data assets into competitive insights that will drive business decisions and actions using people, process and technologies.
Analytics typically crosses multiple lines of business and may incorporate data from external agencies.
Analytics looks forward.
In other words, Analytics gives us a way to make sure the whole business is running right, and lets us discover factors that give us a competitive advantage.
Jump to a section
Types of Reporting
Whereas Workday is now the primary location for HR and financial reporting, the data warehouse is the central location for most other reporting, including:
- Custom reporting done by trained report authors. See the Cognos Training, Tableau Training, or Power BI page for more information about available training opportunities.
- Cross-domain reporting: Combining data from various data domains, such as Research, Finance, and HCM in a single report. In the new data warehouse, all incoming data is translated into a similar “language” so it can be combined.
- Legacy reporting on HRMS and AIS/FIS data: Now that Workday is live, all new HR and finance data will be entered there. As part of the systems retirement plan, the outdated HRMS and AIS systems were decommissioned on November 15, 2022, and the warehouse is where users go to access Legacy HRMS and AIS data via one of our reporting tools.
The data warehouse also provides reporting for systems without strong reporting capabilities.
What is meant by Legacy Data?
Legacy data refers to FIS and HRMS data prior to the Workday go-live date.
Legacy data structures (old General Ledger to FDM > financial data model in Workday) got changed for the Workday implementation.
Reporting Tools
Our primary tools for reporting and analytics are Cognos, Tableau, and Power BI.
Each can be used to do multi-source analysis, but with a few key differences:
- Cognos is very good at crunching large volumes of data but it needs to have packages built to develop reports
- Tableau is very good at visual representations of data but it can’t crunch large volumes of data; it is more exploratory
- Power BI is an intuitive business intelligence tool that provides users the ability to aggregate, analyze and share data through visualizations and dashboards
We are using all of these tools in order to leverage the strengths of each.
Data Warehouse Resources
All resources require a Box login
A Data Reference Model is a high-level representation whose primary purpose is to promote the common identification, use, and appropriate exchange of data/information across the university. The DRM helps us to create standards for both the objects in the model and how they relate to one another.
Washington University Data Reference Model (view on this page)
Washington University Data Reference Model (Box file)
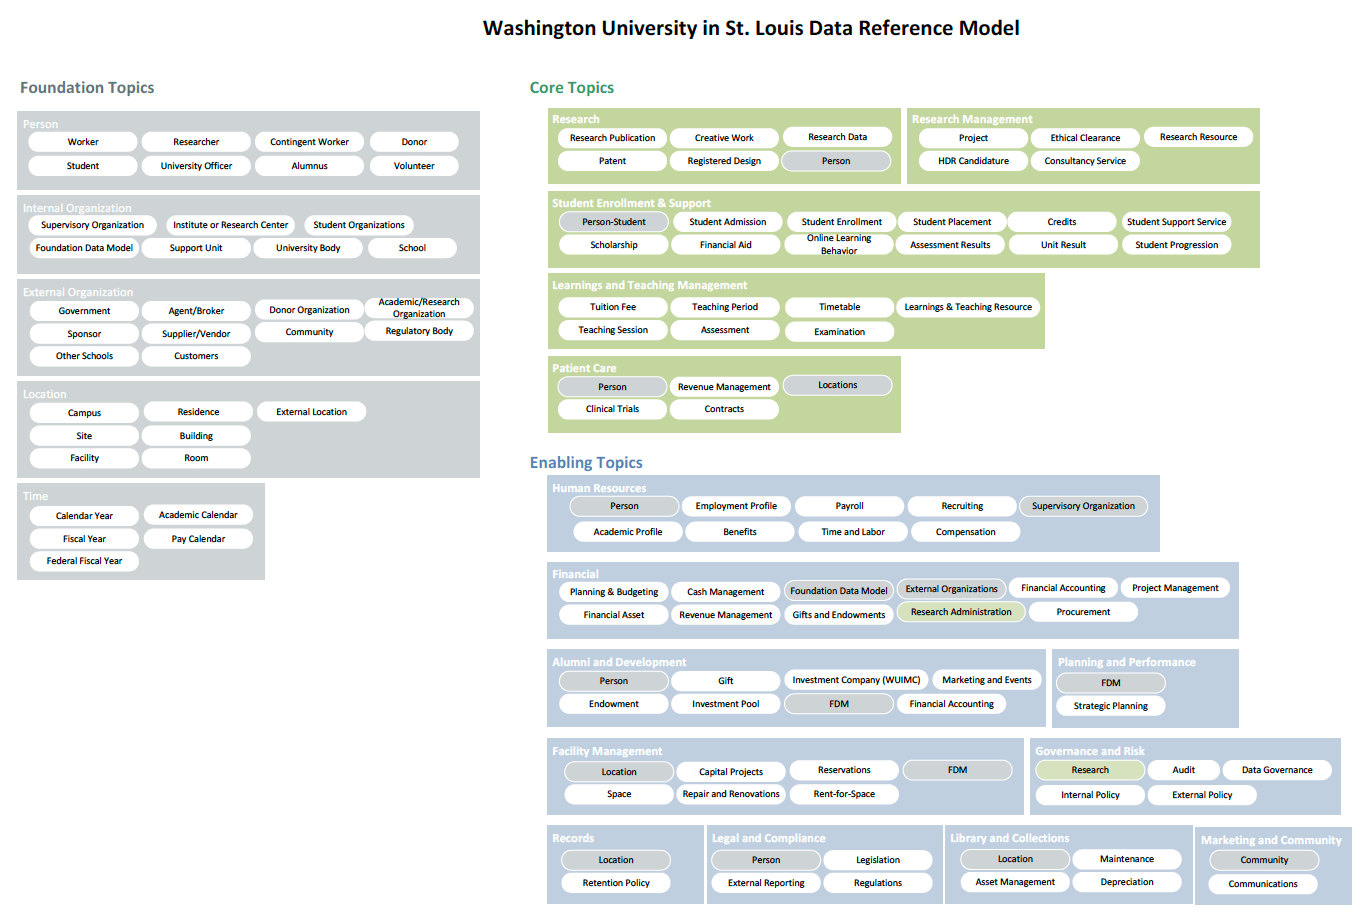
When you are interfacing with the data warehouse, it is important to understand the bigger picture. Our data is vast and complex – a collection of multiple businesses put together – so a mind map like the Data Reference Model (above) is helpful to understand it.
Why do you need to know how our data is structured? A few reasons:
- New hires (like BIs/BAs) – need to understand where is the data, gain insight into how it all relates to one another
- Helps you understand where do certain funds come from, complexities of business (for your area), etc.
- Helps you understand how the same data can appear in multiple domains (staff, faculty, student, patient, etc)
- Helps you understand how to accomplish answers to business questions, especially if more than one domain is involved