The Data Management & Analytics Team is pleased to offer Cognos version 12. This section will provide information and resources related to the new version of Cognos.
If you have not used Cognos in a while, we recommend also checking out the previous version info below.
What has Changed?
This upgrade brings the following changes to Cognos:
- Query Studio, Report Studio, and Cognos Workspace have been removed
- Assistant is now accessible from any view in Cognos, including the homepage
- New features and enhancements (see next section)
Key Features & Enhancements
Assistant (AI)
Assistant is now available from any view in Cognos. It was formerly only accessible from Dashboards, Explorations, and Stories. The Assistant features a new look and a more intuitive and guided experience.
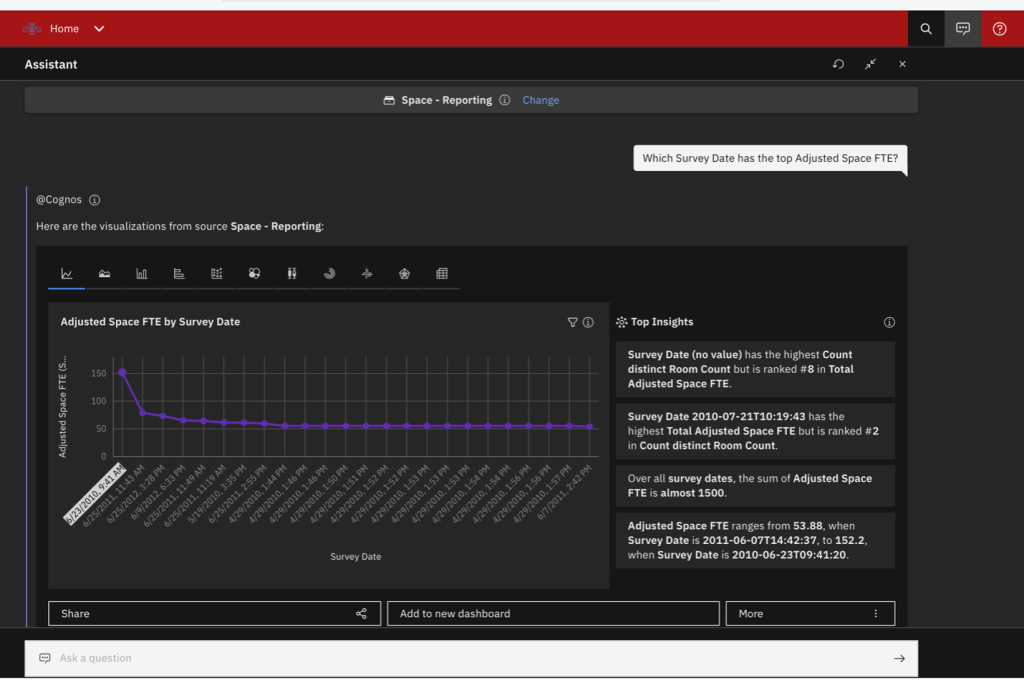
Additionally, the Assistant has been enhanced with natural language capabilities, allowing it to understand comparatives and additional filters. For example, you could ask the assistant questions like:
- How do marketing costs for the last two years compare?
- What is the difference in vendor costs between the last two years?
Also, with this version, you can now create a Dashboard from a visualization that was returned by the Assistant in response to your question. (use “Add to new dashboard” button beneath the visualization)
Please note: The Assistant only works with Cognos packages that have been enriched by the Cognos Administrator. If you try to use a package in the Assistant that has not been enriched, you will receive a message indicating “This data source has not been enriched.” If you would like a specific package to be enriched in order to use it with the Assistant, please submit a request to data@wustl.edu.
New Dashboard Features
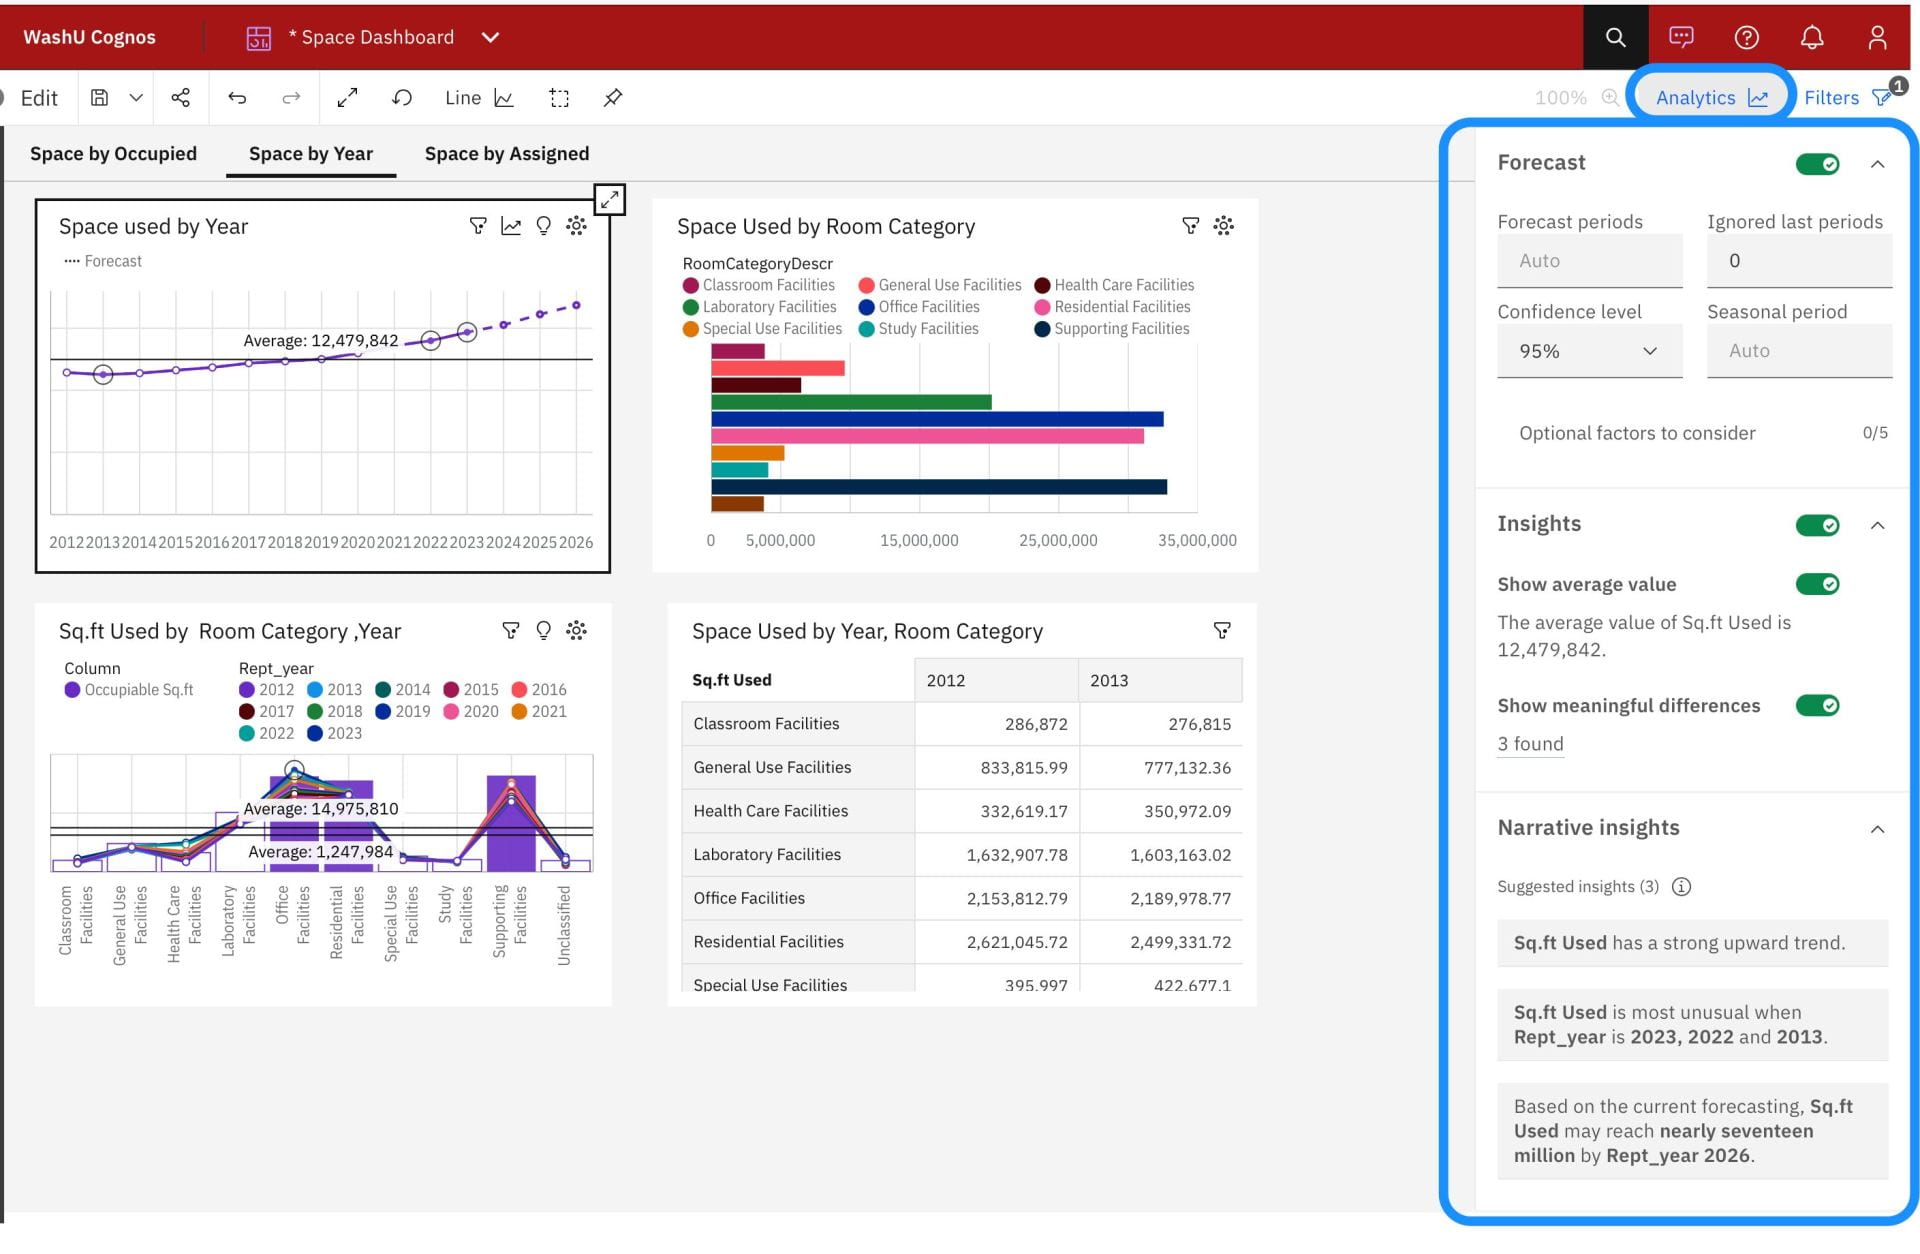
Insights, Forecasts, and Narrative insights:
You can now access visualization (dashboard) insights and forecasting feature from the new Analytics panel. Additionally, narrative insights are now displayed there as well, which can help you see meaningful aspects of the chart’s data in natural language.
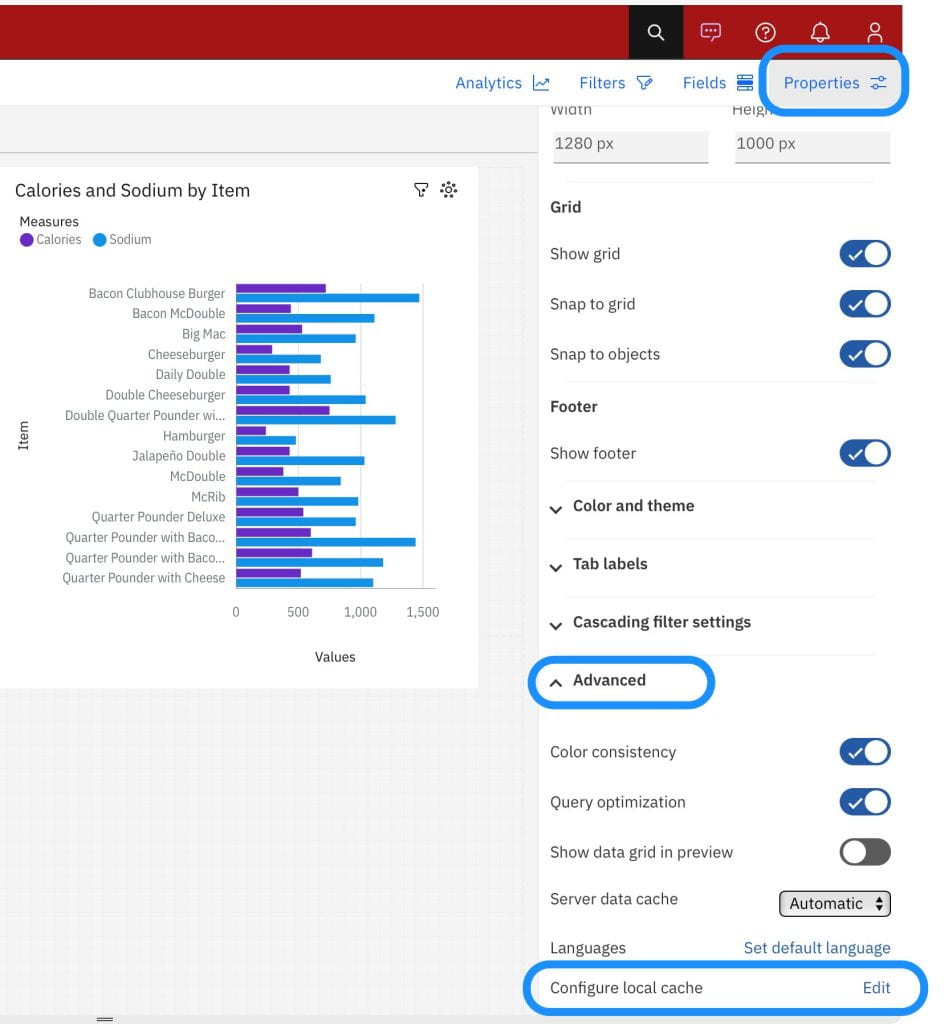
Improved Dashboard Loading with new Caching Feature:
Dashboard authors can now configure specific data to be cached locally, which speeds up load time of dashboards to near-instantaneous. This means you no longer have to base dashboards on datasets to ensure that the dashboard that loads quickly; you can base a dashboard on any package and still enjoy speedy load times.
To enable local caching on a dashboard, first be in Edit mode, then click the Properties icon to see the Properties pane. Click outside of any particular visualization to select the whole dashboard. Expand the Advanced section and click the “Edit” command next to ‘Configure Local Cache’ – then in the dialog that opens, click the ellipses and select “Auto-Create”.
Default Parameter Values
Reporting now includes the functionality to define default parameter values in a report. The values can be specified as a static text, a report expression, or a data item with a corresponding query. Specifying default parameter values for a report eliminates the need for a user to provide prompt values when the report runs. For more details, see IBM’s documentation here.
Other new Reporting & Visualization Features
Interactive Performance Assistant (IPA)
Cognos includes a new performance analysis tool. IPA allows report and dashboard authors to gather and analyze performance details about their reports and dashboards.
Range values based on expressions for Date controls
Report expressions can be used to set range values for Date controls.
Quick links to report objects
The Report overview pane and Parameters pane include links to report objects to make it easier for authors to navigate to the area of the report where the control resides.
Customized Map charts in reports
In reports, you can now provide your-style maps and your-style icons for the Map charts.
Alignment of visualization elements
New properties are introduced that make the positioning of legends and axis labels in a visualization more adjustable.
Map chart enhancements
Several new features were added to the map chart to improve the user experience with this visualization.
Bullet chart enhancements
New utilities are implemented that improve data visualization in bullet charts.
The Data Management Team is pleased to offer Cognos version 11.2.2. This section will provide information and resources related to the new version of Cognos.
If you need to get up to speed quickly, use our handy Cognos 11.2 Quick Start Guide.
PLEASE NOTE: If you have existing scheduled reports or other items, you will need to renew your credentials as soon as possible after the upgrade occurs.
What has changed?
This upgrade brings the following changes to Cognos:
- New login process
- Minor navigational interface changes
- Cosmetic changes to the report authoring interface
- New administrative functionalities such as the ability to add report and folder descriptions
- Exciting features & benefits for report authors (see next section)
Key Features & Benefits for Report Authors
The biggest benefit in this version of Cognos is the ability for report authors to create Data Modules. Data Modules can be created from multiple packages in different domains — or even from an external data source via file upload — and then combined to accomplish cross-domain reporting – no special project requests necessary!
We are also rolling out the ability for report authors to create Dashboards, a great way to perform visual analysis on your data. ‘Datasets’ can be created from packages to act as the data source for your dashboard.
Training & Resources
Training and resources are evolving. We are currently offering the following resources to help you get started with the new version of Cognos and make the most of the great new features and benefits. Check back here for additional resources as they become available.
- Cognos 11.2 Quick Start Guide
- How to convert Query Studio reports into Report Studio reports
- Using Data Modules to do cross-domain reporting (coming soon)
- Dashboard creation tutorial (IBM resource)
Important Note about Query Studio Reports
As of the upgrade to Cognos version 11.2.2, Query Studio reports will no longer be editable in any browser, making them read-only. We encourage any Query Studio report users to convert those reports into the more current Report Studio format, as Query Studio is becoming deprecated.